Monitor the systems that keep your network running.
Network & Backhaul Visibility
Monitor live upload and download traffic across fibre circuits, wireless backhaul links, OLT connections and site-to-site infrastructure from one central view. Tower Sense gives your team clear visibility into how traffic is flowing through the network, making it easier to identify congestion, overloaded links, unusual traffic patterns and developing capacity constraints. Compare link performance over time, investigate slowdowns and make informed decisions about upgrades before network performance begins affecting customers.
Solar & DC Power Monitoring
Monitor voltage, charge current, load current, battery performance and temperature across solar-powered and battery-backed sites from one central platform. Tower Sense helps your team identify abnormal voltage levels, declining battery capacity, charging problems, excessive power consumption and temperature-related risks before they result in equipment failure or site downtime. Historical trends also make it easier to investigate power events, assess system performance and plan battery or solar upgrades based on actual site usage.
Alerts & Escalation
Create intelligent, threshold-based alerts for the conditions that matter most across your network, including device availability, latency, signal levels, traffic, temperature and power performance. Assign severity levels, apply cooldown periods to reduce repeated notifications, acknowledge active incidents and track restored events once conditions return to normal. This gives your team a clear, structured alert workflow and helps ensure critical issues are identified, prioritised and resolved quickly.
Ping & Latency Monitoring
Continuously monitor uptime, packet loss, response times and service reachability across critical internal network targets, backhaul paths and upstream services. Tower Sense helps your team identify intermittent connectivity, increasing latency and unstable network paths before they develop into larger outages. Historical performance trends make it easier to investigate recurring issues, compare service quality and determine whether faults originate within your network or with an upstream provider.
Device Health Monitoring
Track essential router and device health metrics, including CPU load, memory utilisation and available disk space, from one central platform. Tower Sense helps your team identify overloaded devices, memory pressure and storage constraints before they affect network performance or cause service interruptions. Historical trends make it easier to spot gradual degradation, investigate recurring issues and plan maintenance or hardware upgrades based on actual device performance.
Interactive Site Maps
Visualise your network infrastructure through a live, map-based view showing sites, backhaul links, signal levels, bandwidth usage and active alert states. Tower Sense gives your team an immediate overview of network health and connectivity across multiple locations. Quickly identify affected sites, degraded links and developing performance issues, then navigate directly from the map to detailed device, link and site information for faster investigation and fault resolution.
Edge Gateway Monitoring
Deploy a lightweight Tower Sense gateway at your core PoP to provide reliable, local monitoring without requiring a VPN or complex network configuration. Because monitoring is performed from within the core PoP, Tower Sense delivers accurate latency, packet-loss and service-reachability data while continuing to observe local infrastructure during upstream connectivity interruptions. This provides clearer fault isolation and helps your team determine whether an issue originates on-site, across the backhaul or with an upstream provider.
Historical Analytics
Fast time-series storage provides real-time charts and historical performance trends across your network. Review latency, signal levels, throughput, device health and other key metrics to identify recurring issues and investigate incidents. Medium-term telemetry retention gives you the context to understand what happened before, during and after a network event.
Built to Evolve
Tower Sense is continuously evolving. Our development roadmap is shaped by real-world operational needs, industry changes and feedback from our users. Need a feature that is not currently available? We are always open to discussing new functionality, integrations and improvements that could add value to your network.
One view of your network, power and site health.
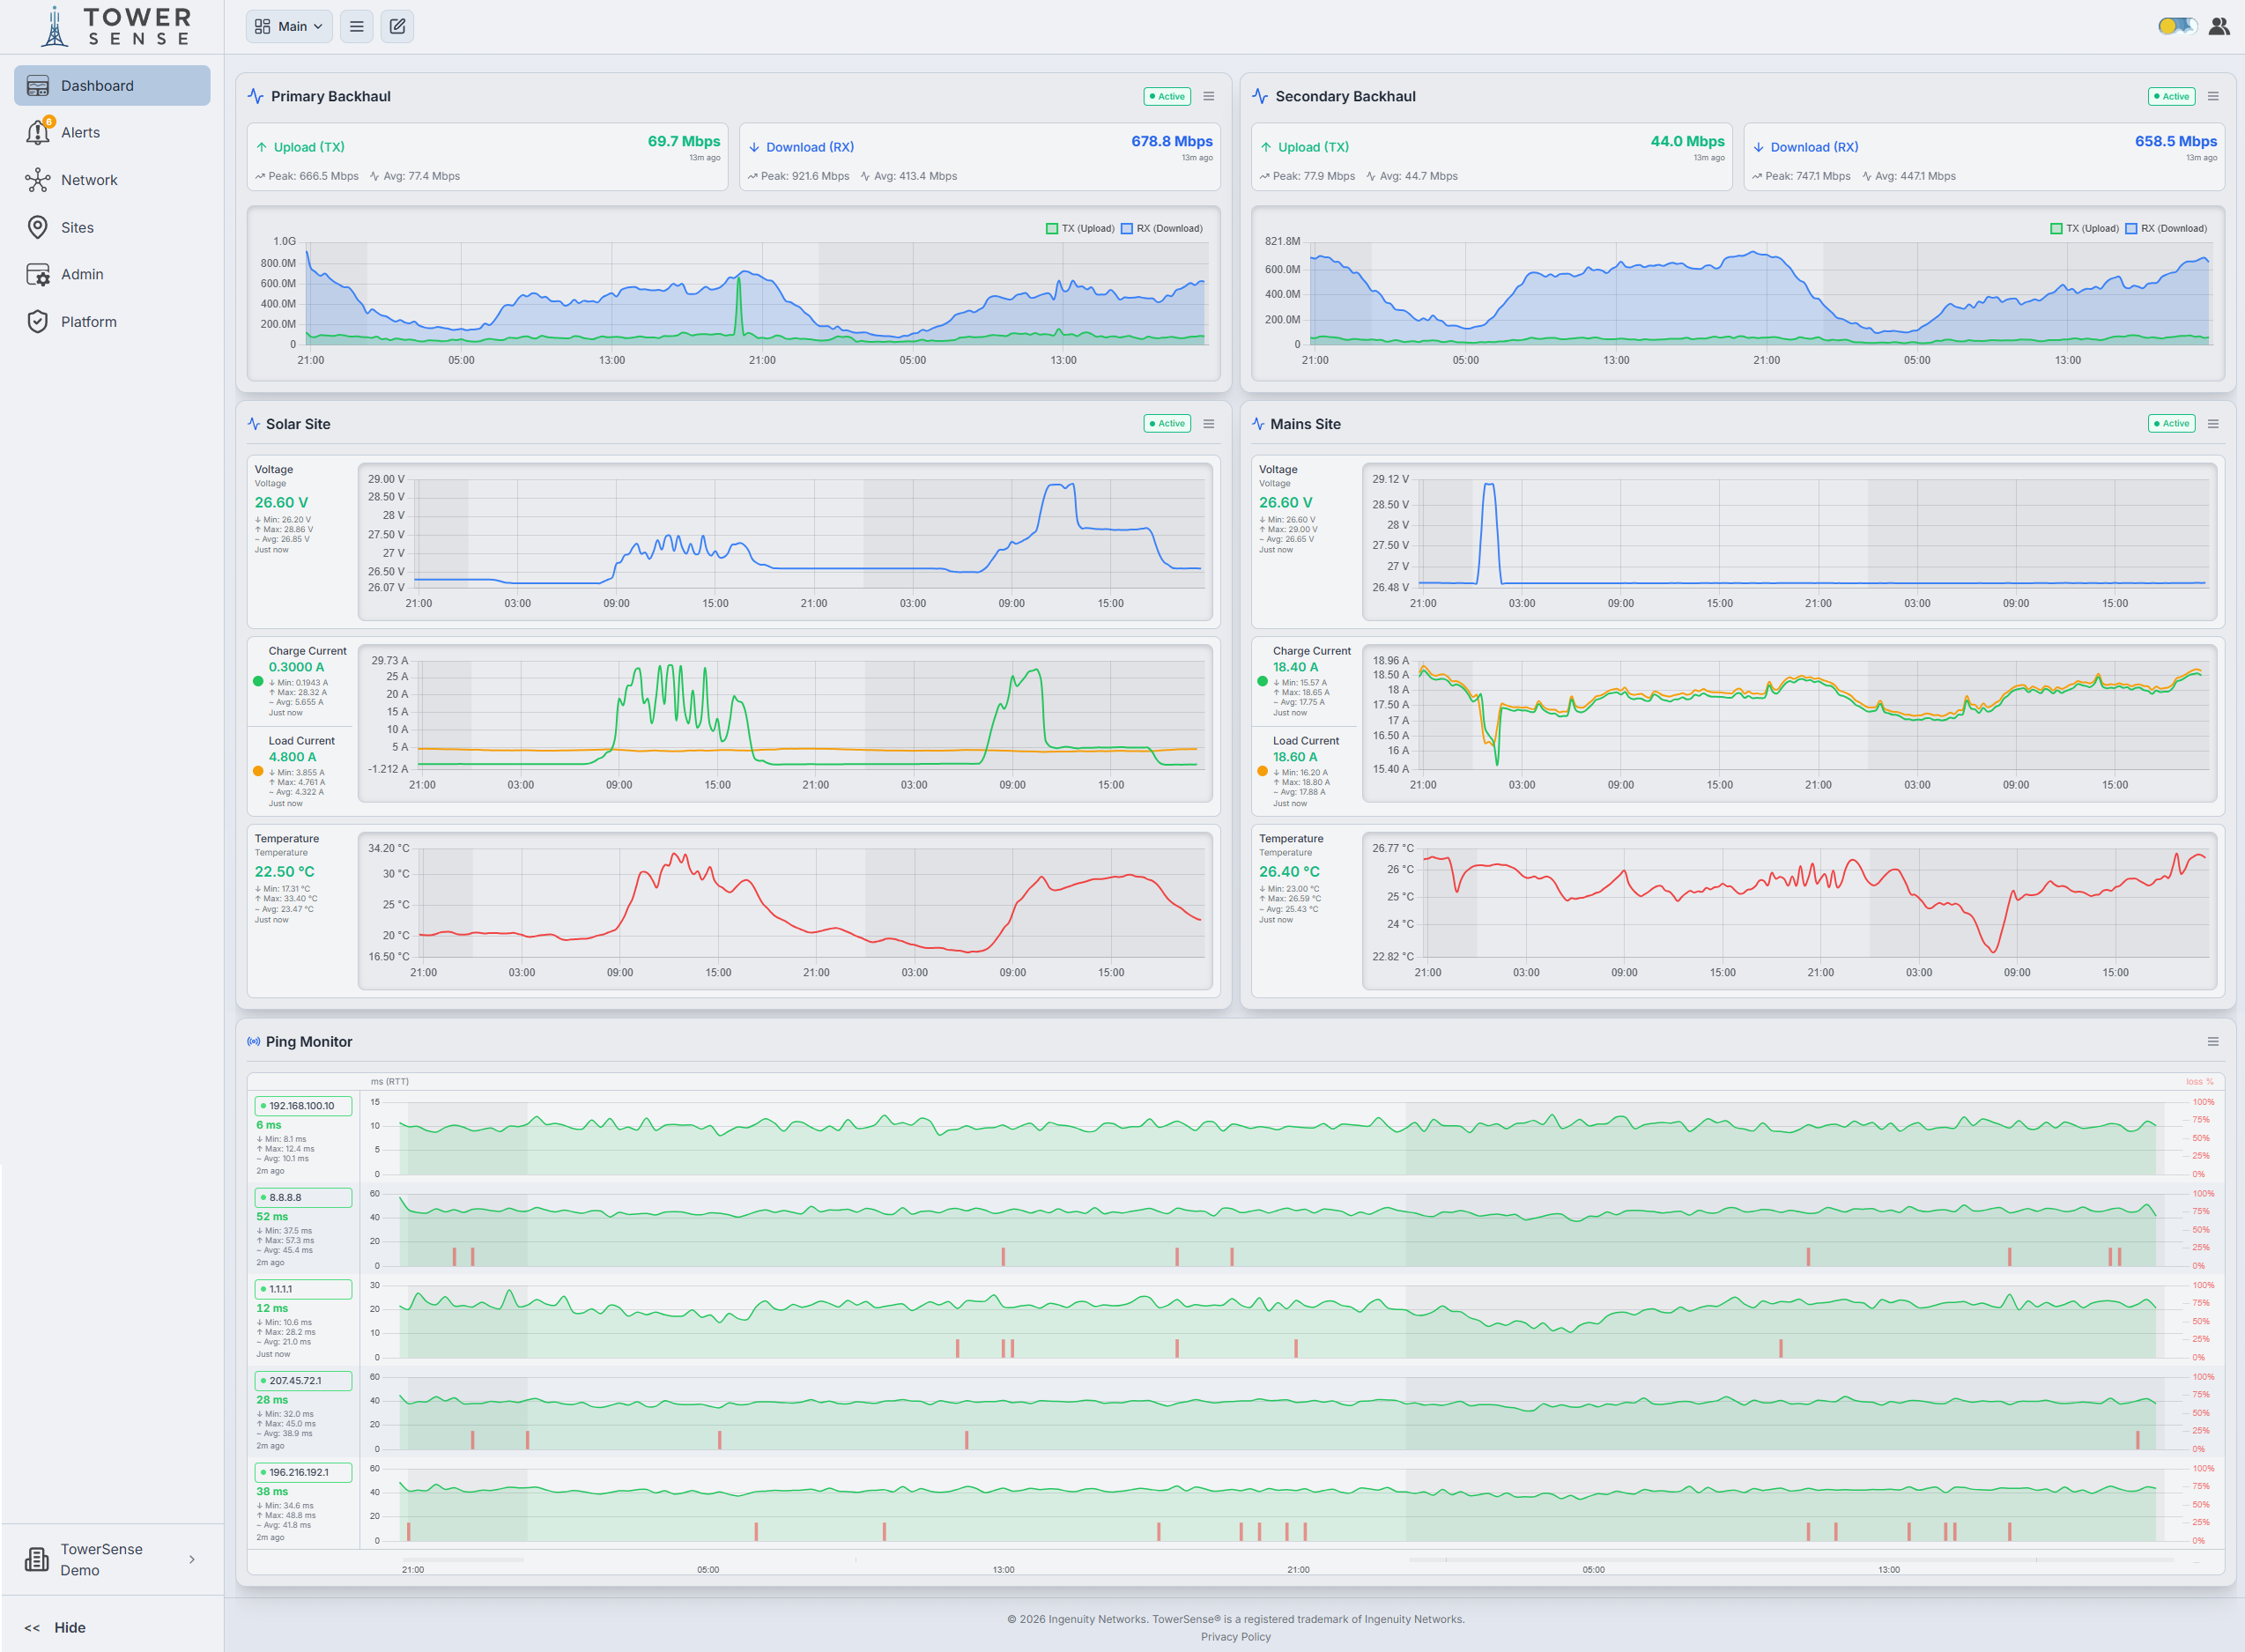
Tower Sense dashboards are fully customisable and built around the way infrastructure teams work. View live and historical graphs for bandwidth, solar power, voltage, load, temperature, latency and device health from a single interface.
Dashboards can be organised by site, service type or operational role, helping your team quickly understand what is normal, what is changing and what needs attention.
- Live and historical graph views
- Bandwidth, power, health and latency monitoring
- Site-based dashboard layouts
- Peak, average and current readings
- Clear operational overview across multiple sites
Network & Backhaul Monitoring.
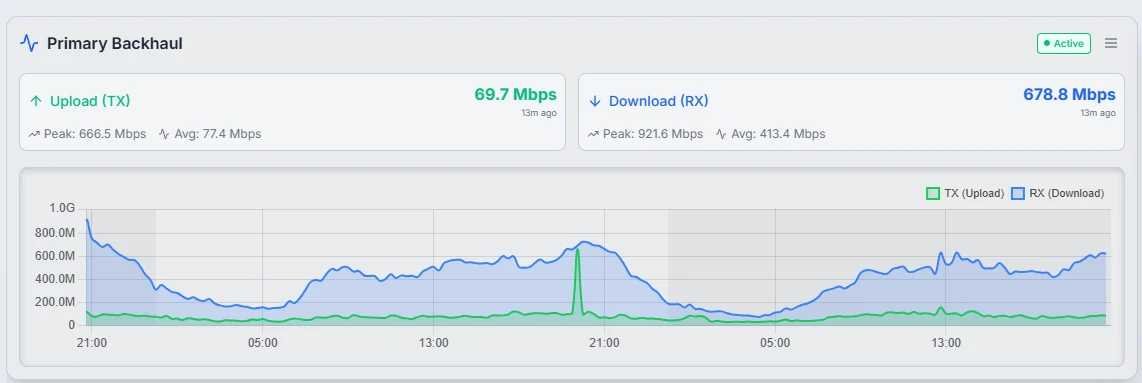
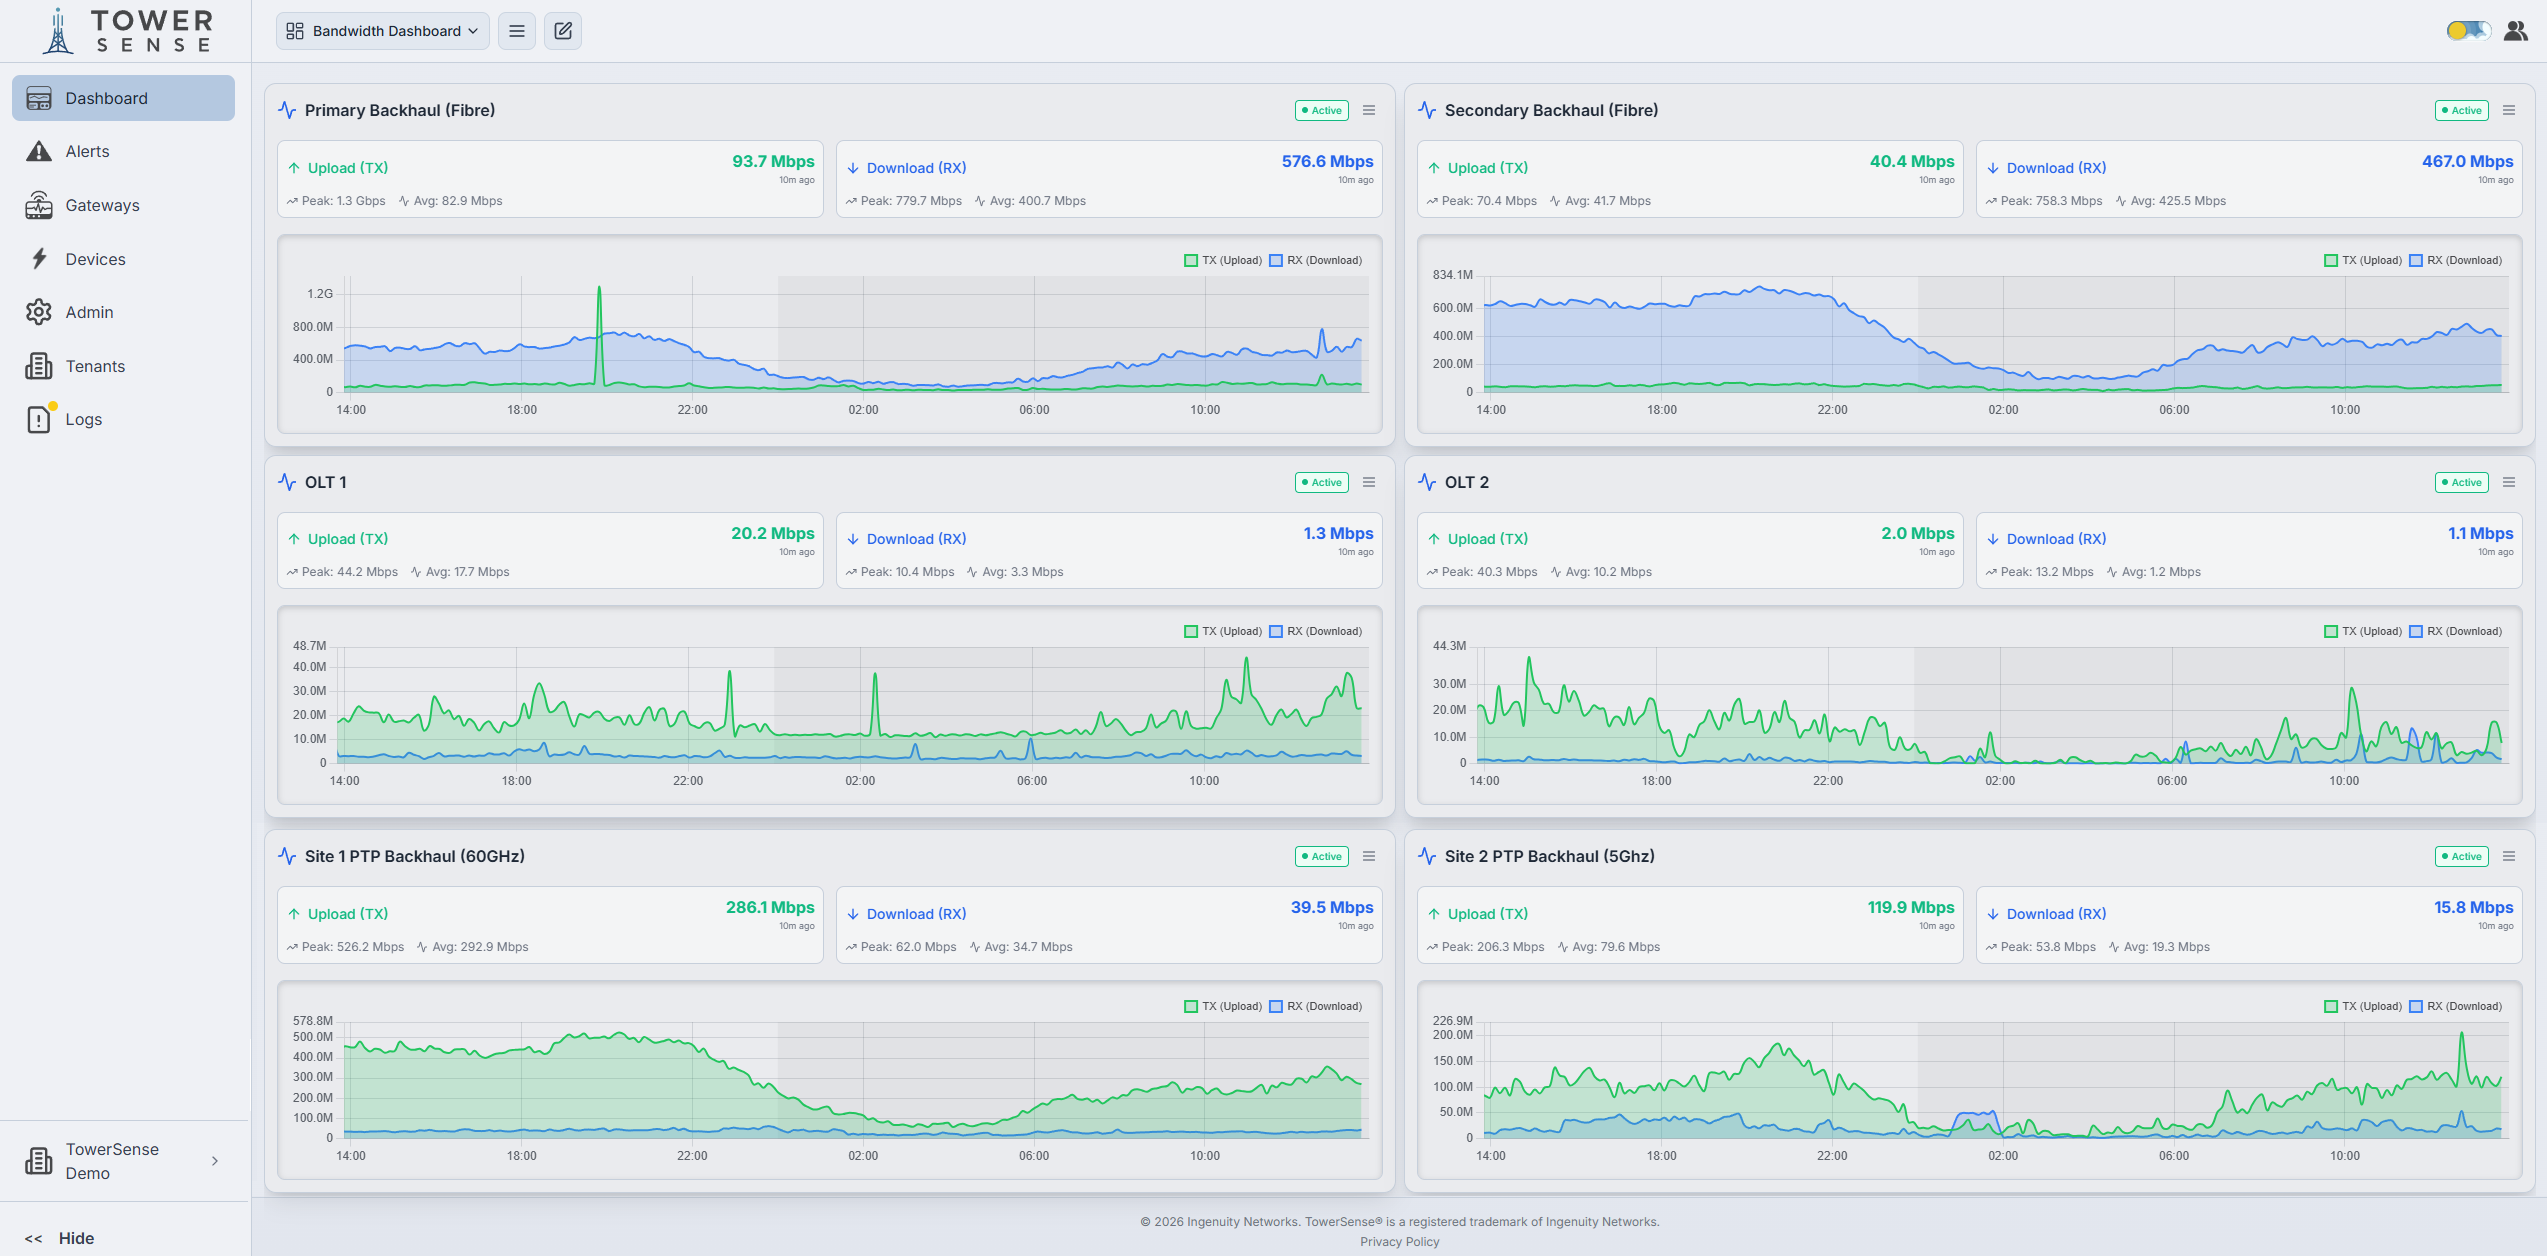
Track backhaul, fibre and wireless link performancein real time.
Tower Sense gives you visibility into upload and download traffic across your core links, backhaul paths and distribution network. Monitor live throughput, view historical trends and quickly identify abnormal traffic patterns or link performance issues.
This is ideal for ISPs, WISPs and operators who need a simple way to see how their sites and links are performing throughout the day.
- Upload and download traffic graphs
- Peak, average and live bandwidth readings
- Fibre and wireless backhaul visibility
- Support for multiple links and sites
- Useful for capacity planning and fault investigation
Solar & Power Monitoring.
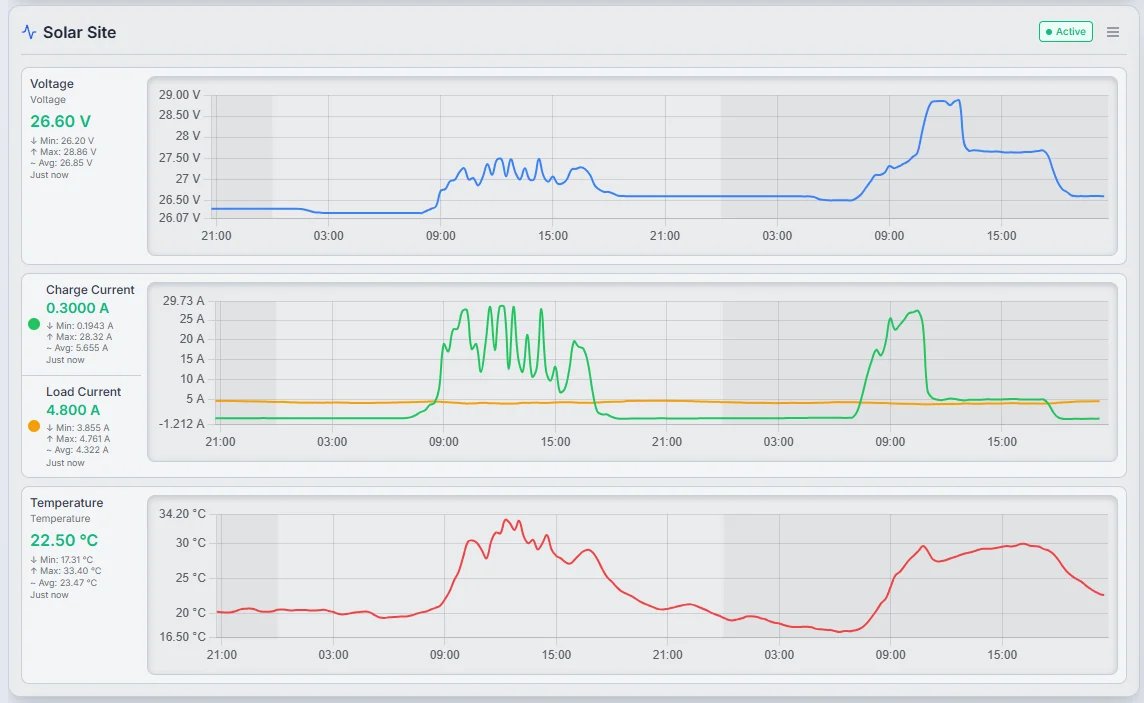
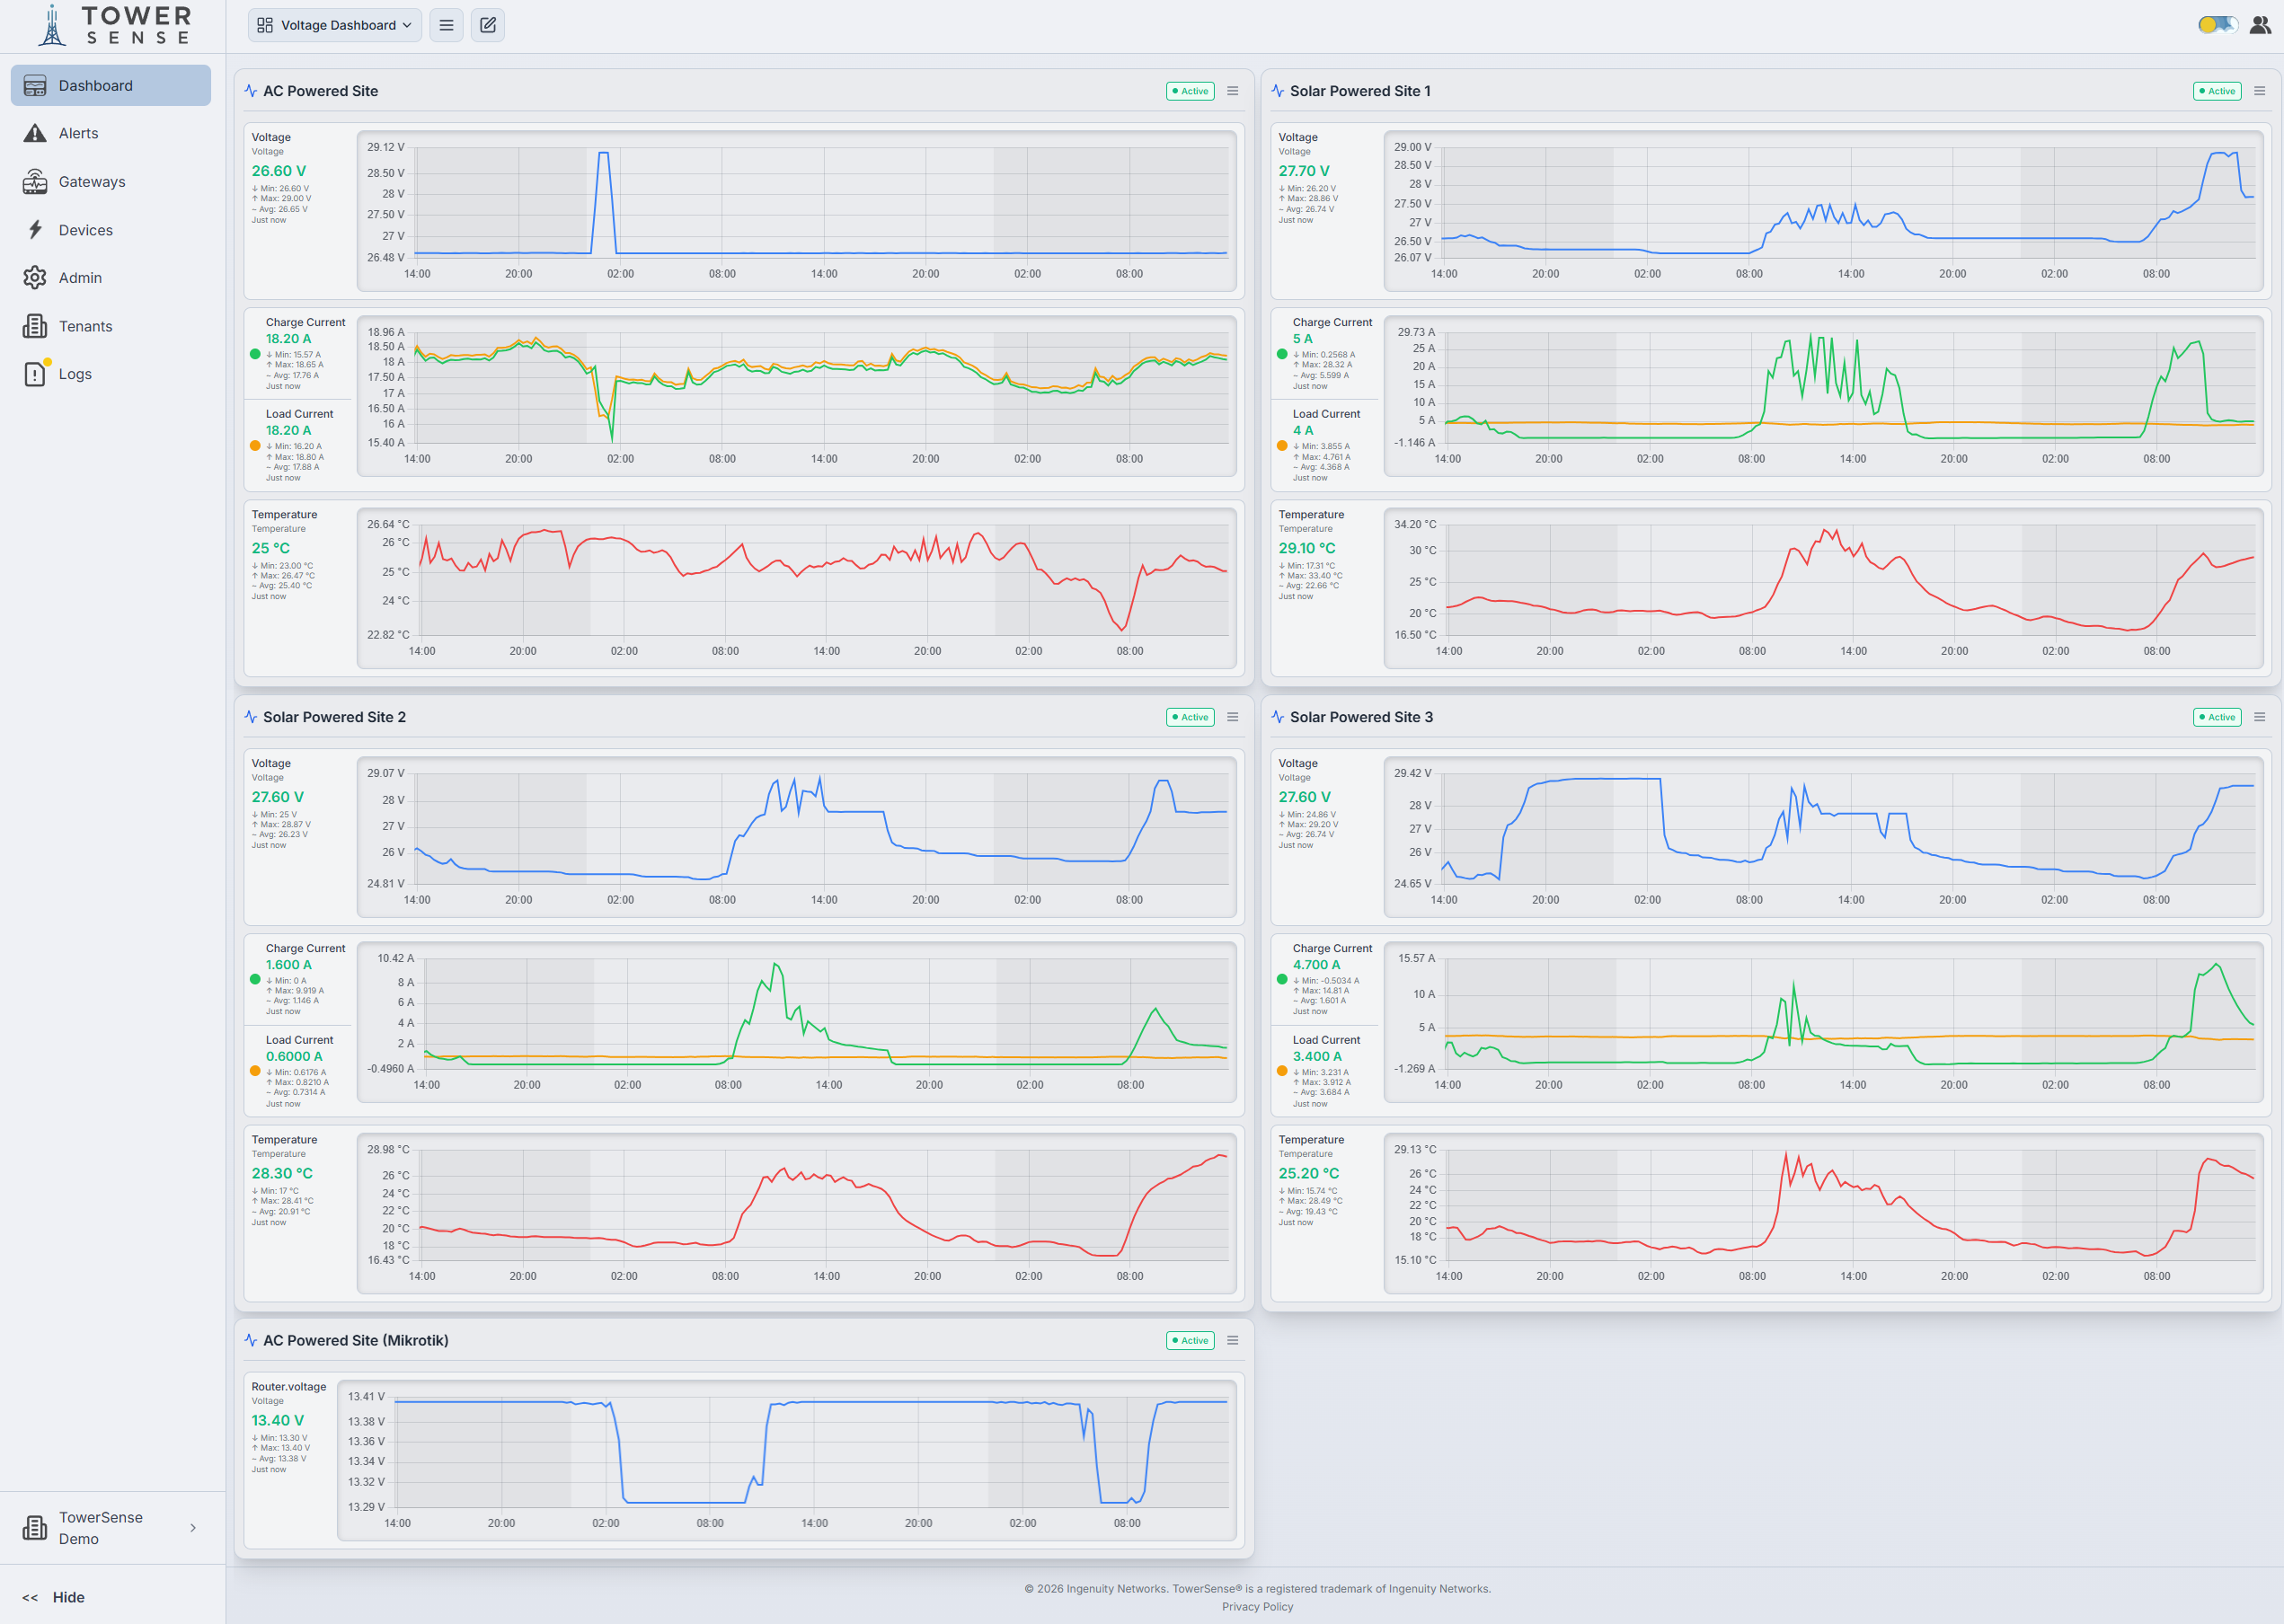
Monitor the power systems behind your remote sites.
Remote sites often fail because of power problems long before the network equipment itself becomes the issue. Tower Sense helps you monitor key power metrics such as voltage, charge current, load current and temperature, giving your team early warning when a site starts behaving abnormally.
Use Tower Sense to keep an eye on solar-powered sites, AC-powered sites, battery systems and equipment rooms from one central dashboard.
- Battery and DC voltage monitoring
- Charge and load current visibility
- Load monitoring
- Temperature monitoring
- Early warning for abnormal power behaviour
Know what is active, what is critical and what has recovered.
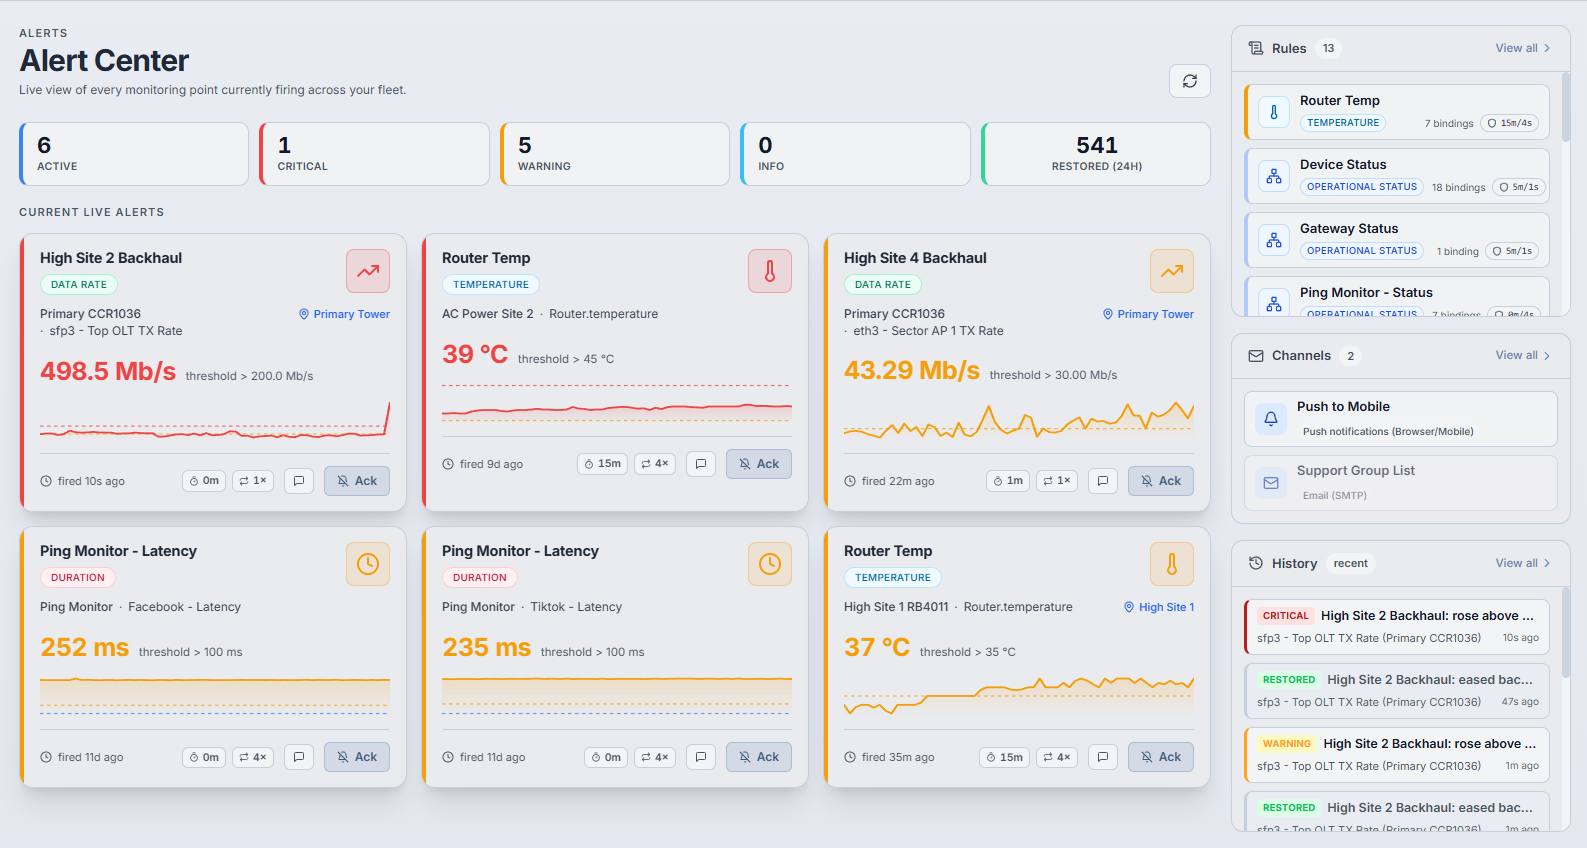
The Tower Sense Alert Centre gives your team a live view of monitoring points that are currently firing across your network. Alerts are grouped by severity, making it easy to identify critical issues, warnings, informational events and restored conditions.
Each alert card shows the affected monitoring point, current value, threshold, duration, repeat count and acknowledgement status.
- Live active alert view
- Critical, warning and info severity levels
- Restored alert tracking
- Alert acknowledgement workflow
- Threshold, duration and repeat indicators
Alert History.
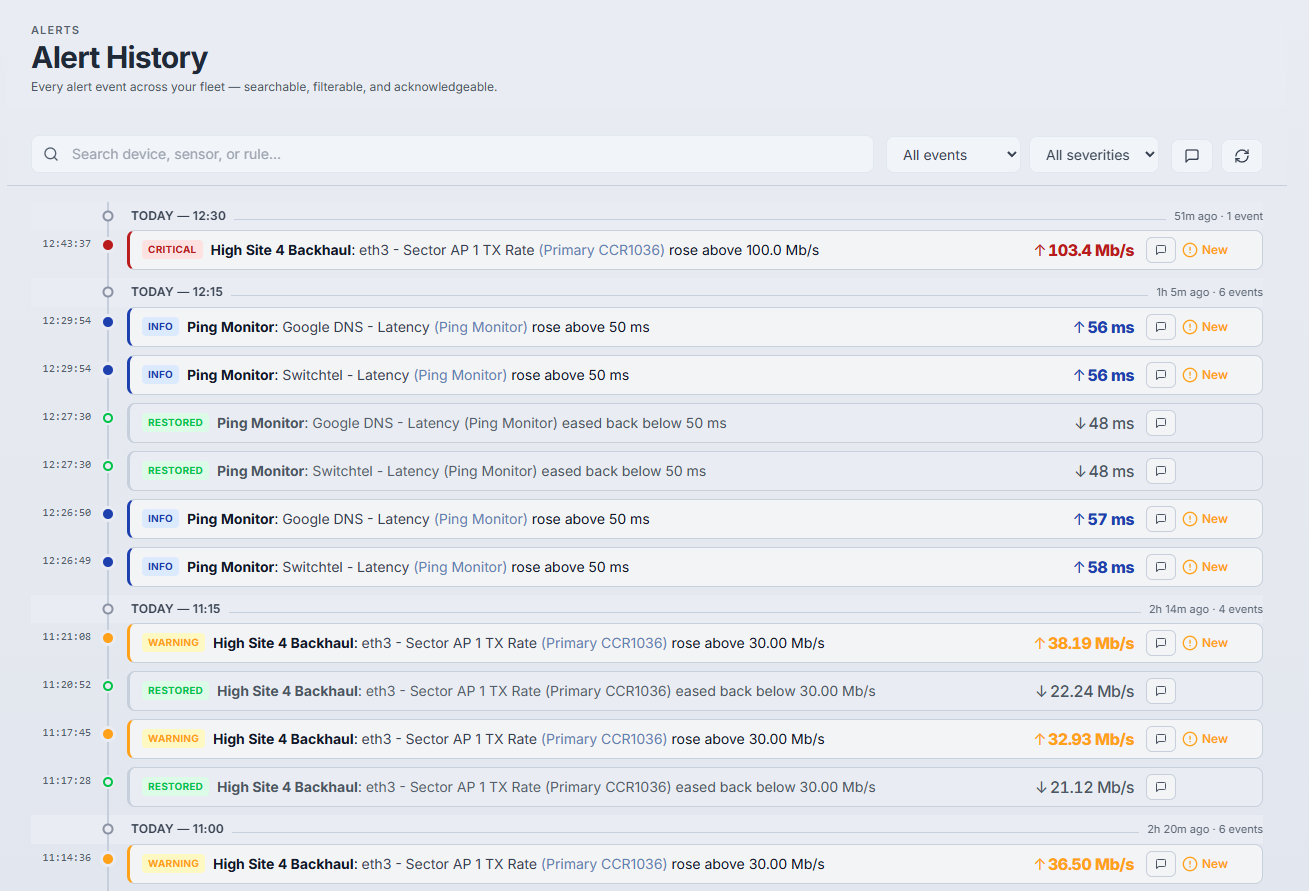
Every alert event across your network - searchable, filterable, acknowledgeable and fully documented.
Tower Sense keeps a clear history of alert activity so your team can review what happened, when it happened, how often it occurred and what action was taken. Search and filter alert events by severity, source, status and time, acknowledge individual events and add notes directly to alerts for troubleshooting context, team handovers and operational reviews.
- Searchable alert event history
- Fired and restored event tracking
- Severity and status filtering
- Source and timestamp visibility
- Alert acknowledgements
- Notes added directly to individual events
- Useful for fault reviews, team handovers and recurring issue detection
Site Maps.
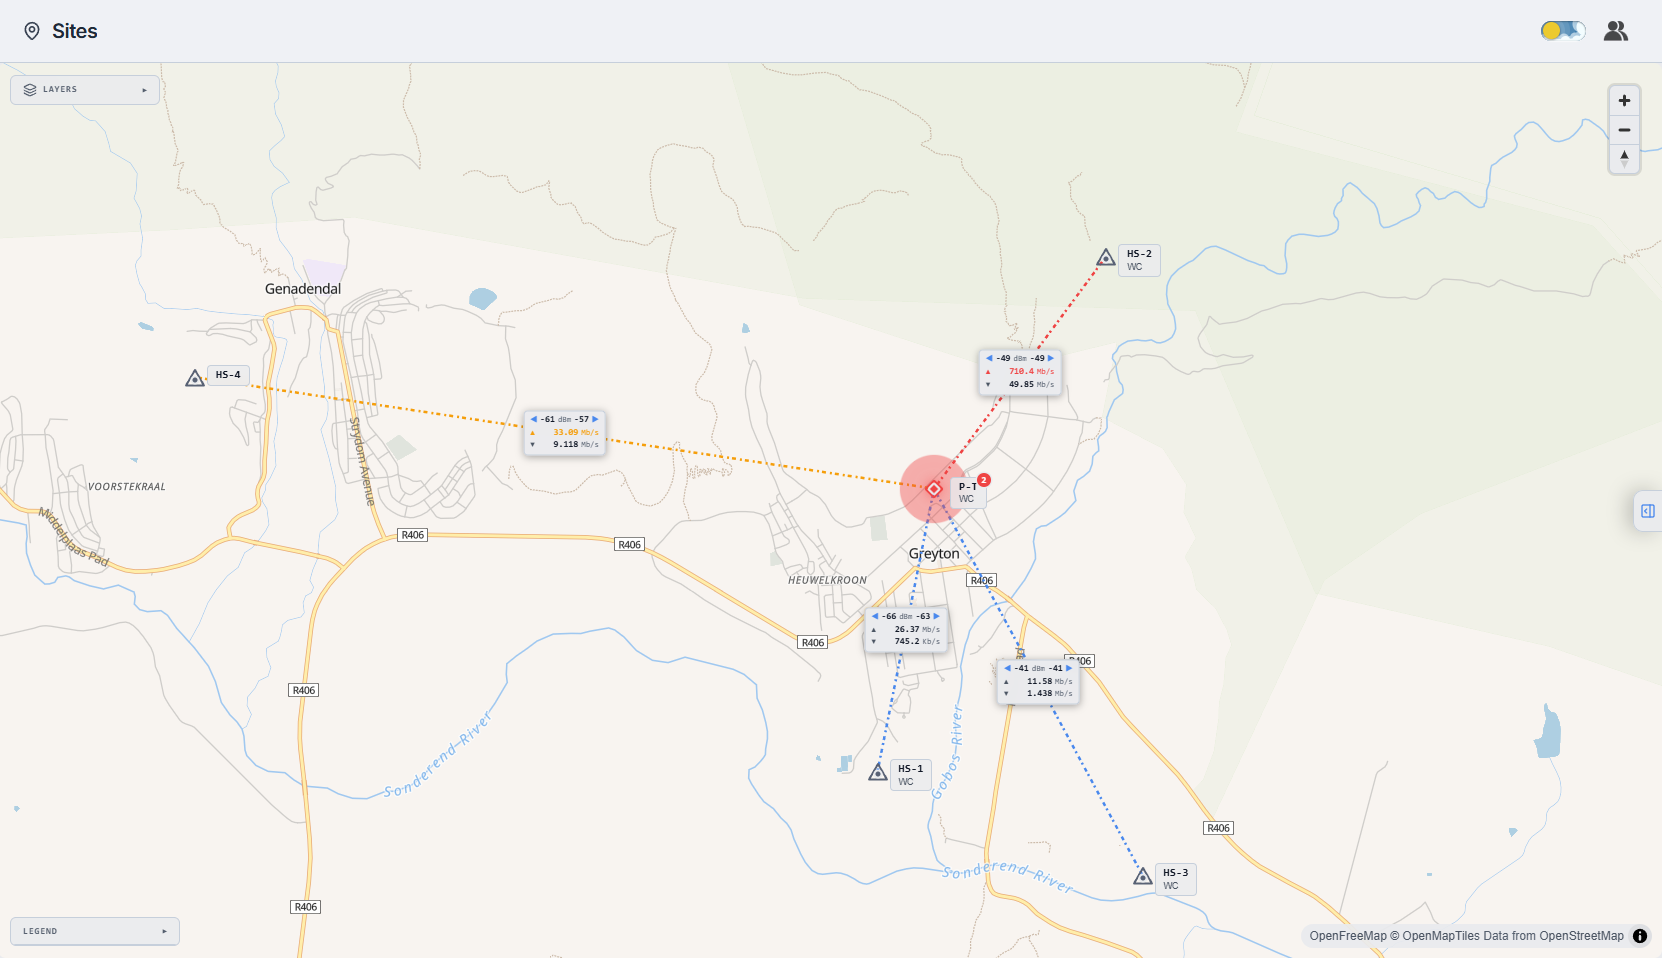
Visualise your sites, links and alert states on a live map.
Tower Sense includes a map-based view for operators who need to understand infrastructure geographically. View sites, links, signal information, bandwidth values and alert states directly on the map.
This helps teams quickly see where a problem is located and how it relates to the rest of the network.
- Live site map view
- Site and link visibility
- Bandwidth and signal information on links
- Alert state indicators
- Useful for WISP and remote infrastructure networks
Ping & Latency.
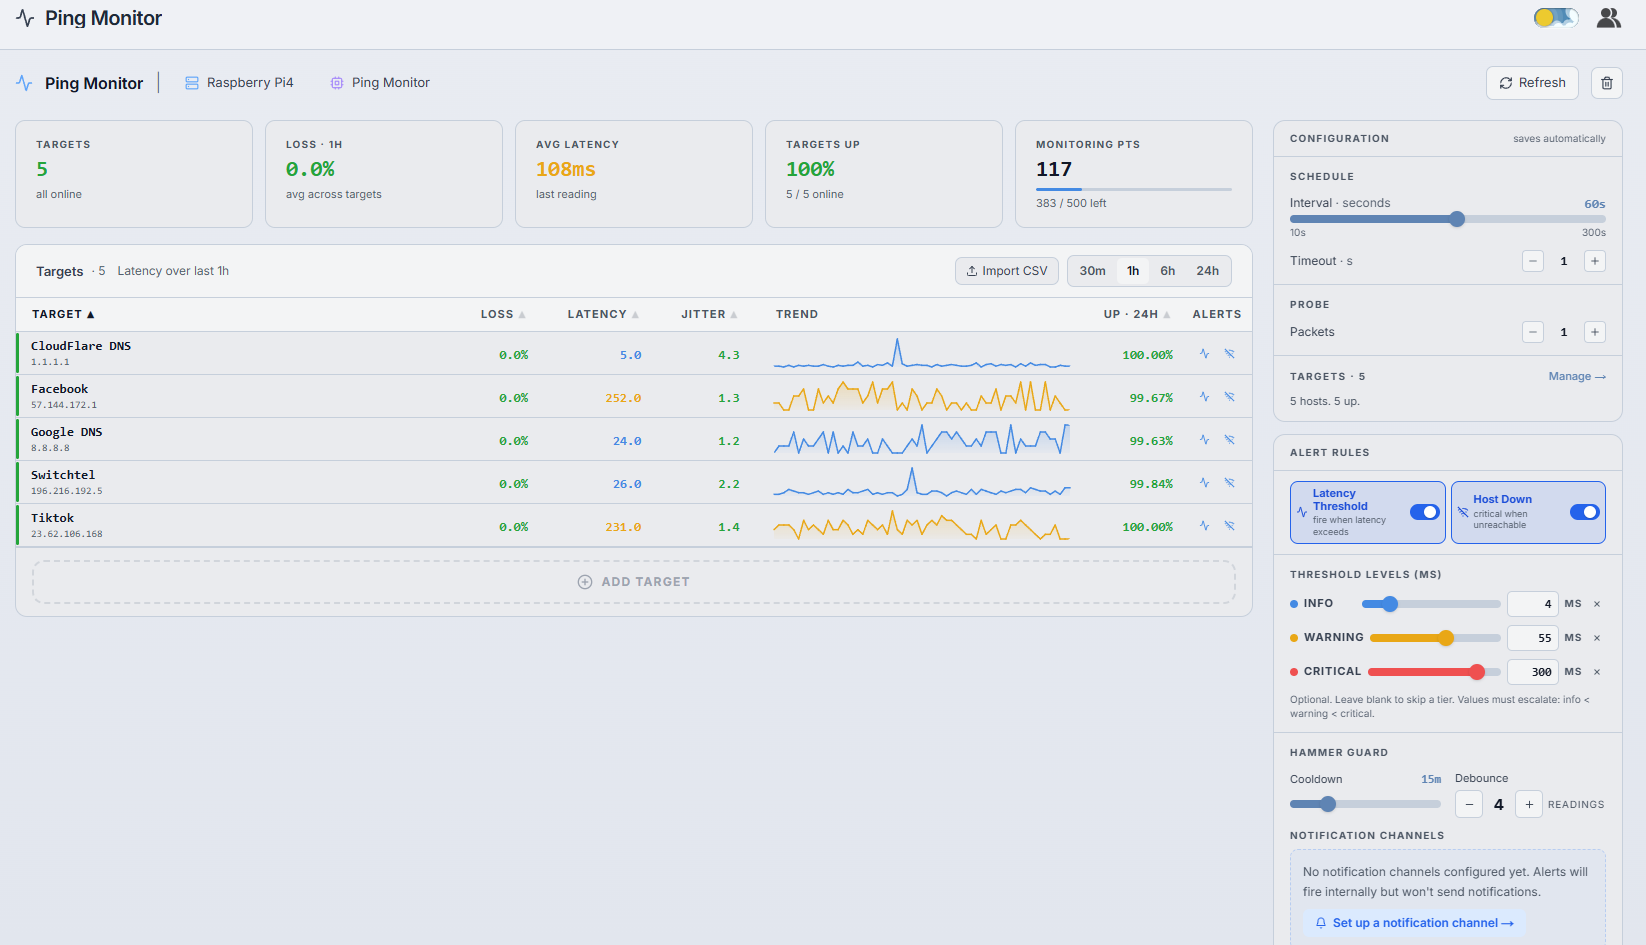
Monitor uptime, latency and packet loss to critical targets.
The Tower Sense Ping Monitor tracks reachability and latency across important targets such as DNS services, upstream services, customer-facing endpoints and internal infrastructure.
View current latency, packet loss, target status, jitter and uptime trends from a clean monitoring interface. Threshold-based alerting helps your team identify latency problems before they become larger service issues.
- Multi-target ping monitoring
- Latency, jitter and packet loss visibility
- Uptime percentage per target
- Configurable check interval and timeout
- Threshold-based latency and host-down alerts
Device Health.
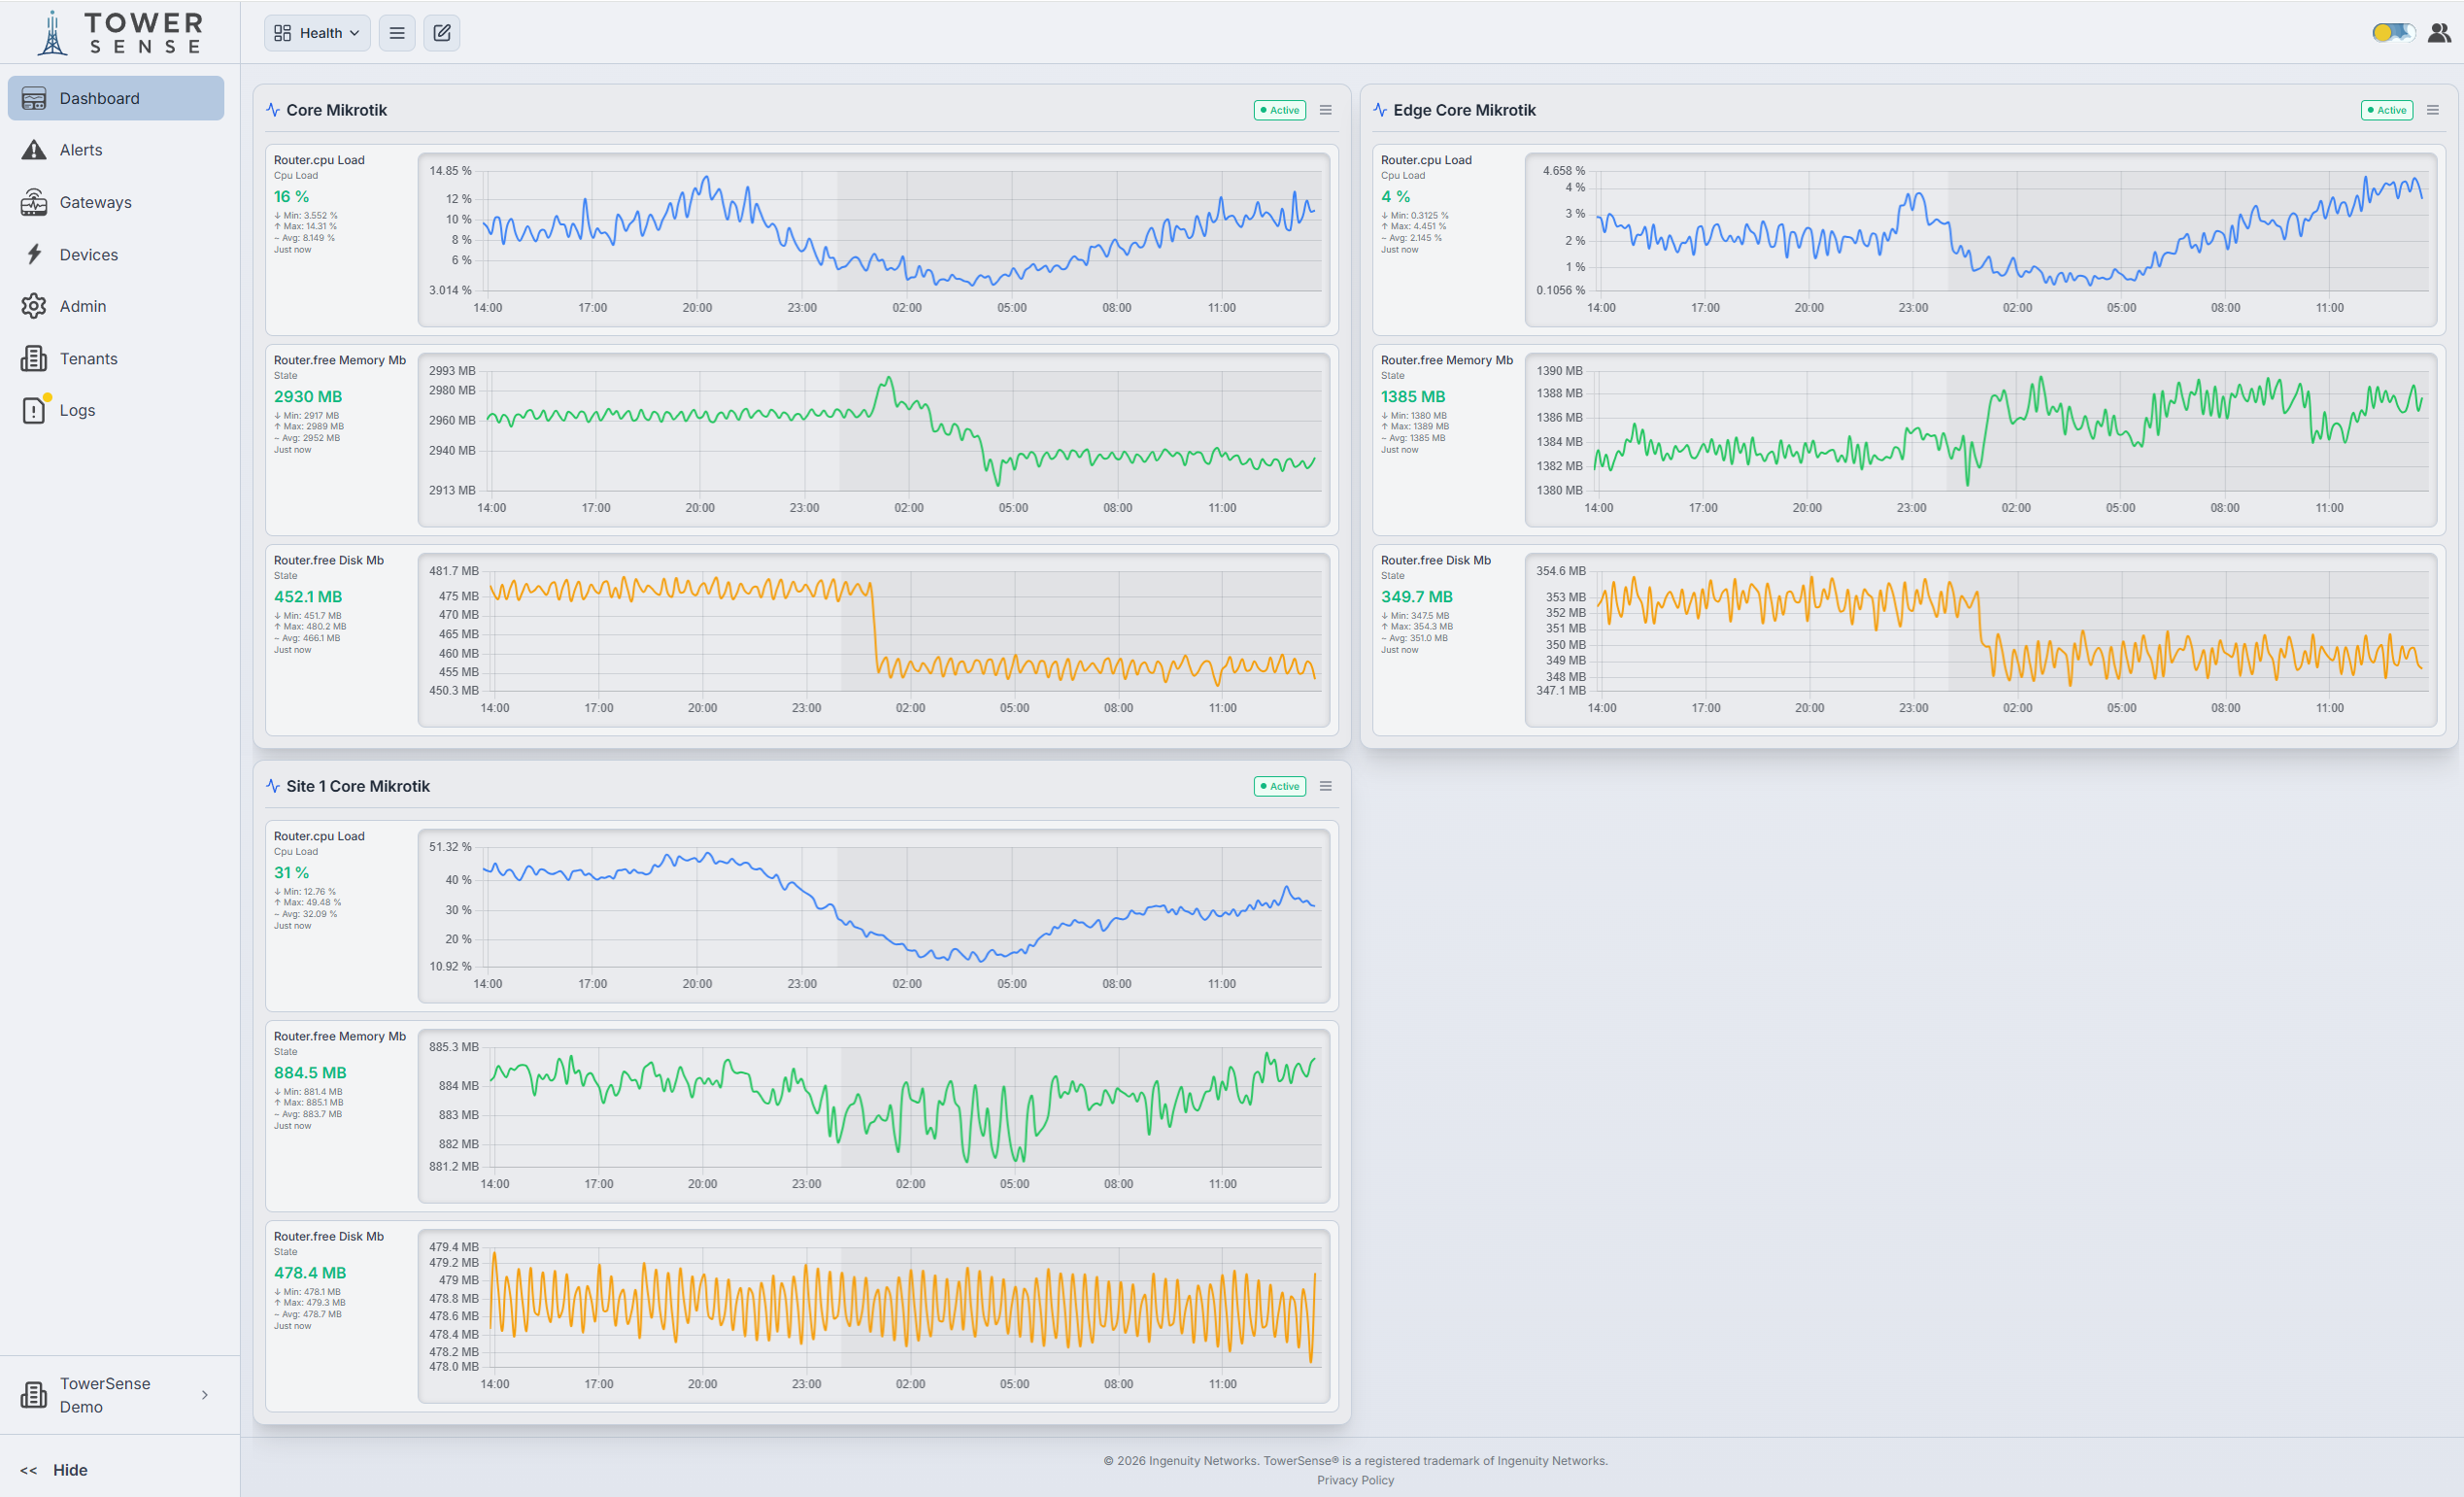
Keep an eye on the devices running your network.
Tower Sense helps you monitor the health of routers and infrastructure devices by tracking CPU load, memory availability and free disk space. This gives your team better visibility into device pressure and helps detect performance issues before they impact customers or site reliability.
- CPU load monitoring
- Memory availability tracking
- Free disk visibility
- Historical health graphs
- Useful for router and gateway monitoring
Ready to move from reactive support to proactive monitoring?
See issues before your clients do!